UK
UK
 AU & NZ
 SG
SG
 MY
MY
 IE
IE


According to the latest Access AI in Hospitality 2025 report hotel managers use on average 5 different systems to manage their operations, and 60% say that the data these systems produce is incomplete or even missing. If revenue managers are working with inaccurate data and an inefficient operational system, this doesn’t help them make confident decisions.
In this article, we’ll explain what RevPAR actually means, the 2 simple formulas to calculate it, guidance on what good RevPAR looks like and 5 easy steps to improve it.
What is RevPAR in hotels?
RevPAR stands for revenue per available room. Understanding what it measures and how it compares from other metrics is what makes it useful.
US hotels finished 2025 at 62.3% occupancy on a $160.54 average daily rate, which came out at $100.02 RevPAR. It was the first full-year drop in occupancy and RevPAR since 2020. Rate held but occupancy didn't and this is what RevPAR catches.
The RevPAR hotel definition, explained simply
The RevPAR definition most operators work to is the room revenue your hotel produces for every room available in a set period, sold or not.
That's a different question from average daily rate (ADR), which only counts the rooms you actually sold. And it's different again from occupancy, which counts rooms without caring what you got for them.
Here's an example:
A 100-room hotel running 70% occupancy at a $200 ADR is performing differently from one running 90% occupancy at a $150 ADR. The first has a RevPAR of $140. The second has $135. The second hotel looks busier on every report its GM sees, and earns less per room while doing it. RevPAR is what shows you that in a single number.
Why RevPAR matters more than occupancy alone
High occupancy sounds like a win, and often it is. But a hotel running 88% on heavily discounted rates can be leaving more on the table than one running 74% on a rate strategy it actually holds.
For context, the US industry averaged 62.3% occupancy across 2025. Wherever you match that, the occupancy line on its own won't tell you whether the rooms were worth selling at the price you sold them for.
Read RevPAR and occupancy together and you get a different picture because a busy hotel and a profitable one aren't the same.
How to calculate RevPAR two ways
Now you know what RevPAR can do for your hotel, it's time to work it out. There are two routes to the same number, and both are useful for different jobs. You'll see the RevPAR formula in hotel P&Ls and PMS reports written either way.
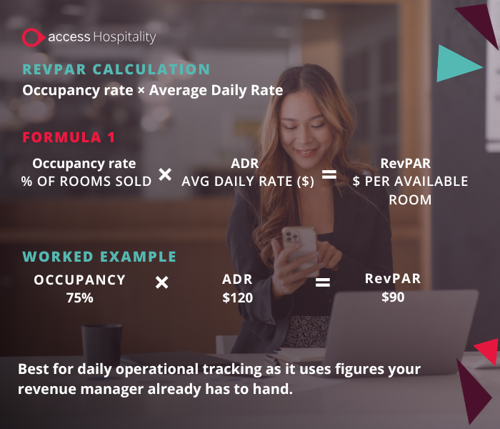
RevPAR formula 1: occupancy rate x ADR
The RevPAR calculation you'll see most often is:
The RevPAR equation: Occupancy rate x Average Daily Rate (ADR)
Example:
75% occupancy on a night when your ADR is $180 gives you a RevPAR of $135.
Use this one for daily tracking and operational reporting. It runs off figures you already have on your morning report.
RevPAR formula 2: total room revenue / available room nights
The other route is:
The RevPAR equation: Total room revenue / Total available room nights
Example:
$81,000 in room revenue across 600 available room nights, which is a 20-room property over a 30-night month, gives you $135 again.
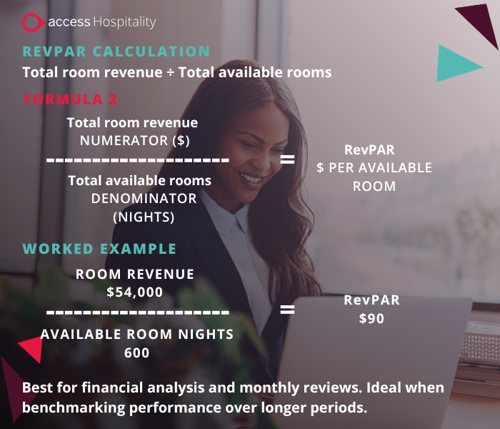
This route works better for financial analysis, monthly reviews and benchmarking over a longer period. It's the same revPAR calculation formula either way, you're just coming at it from a different direction.
If you'd rather not run it by hand, a RevPAR calculator, whether that's a spreadsheet template or a report inside your hotel PMS, saves you the period-matching errors that trip up most manual versions.
What a good RevPAR looks like for US hotels
There isn't one number that counts as good. It depends on your market, your chain scale and your season. But 'it depends' isn't much use on its own, so here's what the US market actually did.
Benchmarks to have in mind
Across 2025, US hotels averaged $100.02 RevPAR on 62.3% occupancy and a $160.54 ADR. The spread underneath that average is the more useful part. New York ran 84.1% occupancy at a $333.71 ADR for $280.71 RevPAR. San Francisco added 11.8% to reach $155.84. Las Vegas dropped 10.9% to $149.13, and Houston's occupancy fell 8.6% to 58.9%.
Looking forward, CoStar and Tourism Economics upgraded their US forecast in June 2026 to 2.8% RevPAR growth for the year, on 62.8% occupancy and 2% ADR growth.
So the national figure is a starting point, not a target. Smaller independent hotel properties will naturally sit lower, while big brands and luxury properties will sit well above it.
Whatever size your hotel is, the benchmark we always encourage our customers to look at is their own performance over time, and then their comp set. A STAR report, the benchmarking report most US hotels buy from STR, tells you how your comp set performed so you can measure yourself against it. If you subscribe, your RGI (RevPAR Index or Revenue Generating Index) shows how your RevPAR compares against that set. An RGI of 100 means you're taking your fair share of the market. MPI (Market Penetration Index) does the same job for occupancy and ARI (Average Rate Index) does it for rate.
Why RevPAR only gets you so far
The main thing to remember is that RevPAR is a room revenue metric. It doesn't capture what you earn from F&B, parking, spa, meetings and events, or resort and destination fees.
Those fees are worth a separate note in the US. Since the FTC's Junk Fees Rule came into force in May 2025, mandatory fees have to be shown in the total price up front. That revenue still sits outside RevPAR, but how you display it now affects how you compare on a results page, and that very much shows up in RevPAR.
The bigger limit is cost. A hotel with strong RevPAR and loose cost control can end up less profitable than one with a lower RevPAR that runs tight. Which is why owners and asset managers read RevPAR next to TRevPAR (Total Revenue Per Available Room) and GOPPAR (Gross Operating Profit per Available Room) rather than on its own.
5 ways to increase RevPAR in your hotel
Improving your RevPAR means working on both occupancy and average rate at the same time. Here are 5 that make the biggest difference.
1. Use dynamic pricing to protect your average rate
Flat or seasonal rates will see you leave revenue on the table. With dynamic pricing, you move rates with demand like citywide conventions, college football weekends, graduation, spring break, festival and race weekends, plus your own booking pace and competitor availability.
Three in four hoteliers we asked in our 2025 AI in Hospitality report said access to consolidated, real-time data would meaningfully speed up their decision-making, which is what makes dynamic pricing work so well.
Using a dynamic pricing strategy constantly will help you see a stronger RevPAR, especially during busier periods when static rates can’t keep up with the pace in demand.
2. Shift your channel mix to cut the commission drain
Every OTA booking costs you more than the invoice shows, which reduces your net RevPAR and eats into your room revenue. US OTA gross bookings hit $100.3 billion in 2025, and hotels account for 63% of that. The OTA business is, mostly, a hotel business.
Shifting even a portion of your bookings to direct channels or your own booking engine improves the revenue you retain per available room. We suggest always tracking your distribution mix alongside RevPAR as a habit as it shows you where the financial gap is and it’s much quicker than chasing higher rates.
3. Set minimum length of stay across your peak dates
On compression nights, the ones where the whole market fills, a single-night booking can block a three-night one. Minimum length of stay (MLOS) restrictions stop that happening.
Review your cancellation and rate fence policies at the same time, particularly around sudden spikes in demand. That's where revenue leaks out through last-minute changes.
When you have access to real-time booking data rather than manual reports, these decisions become much faster and more confident.
4. Fill shoulder periods without dropping your rate
RevPAR drops in the quiet periods, but usually not because demand disappears. It’s because pricing strategies become similar.
Use your hotel data to identify target audiences, whether that’s midweek corporate travelers or guests looking for a leisurely weekend. Then go after them with something other than a lower rate.
Understanding your guests and what they are looking for in these lulls will help you reach the right audience at the right time. It’ll also train guests not to expect discounts at the end of peak seasons.
5. Connect revenue and operations before your guests feel it
Improving RevPAR isn't only a revenue management job. Higher occupancy puts pressure on housekeeping, the front desk and your labor schedule. If operations can't flex with demand, the guest is the one who notices.
Disconnected systems lead to teams pulling a report out of one system to key it into another, and every hour spent doing that is an hour not spent on the decision the report was for. Access research puts the cost at around 286 hours a year per manager, with 13% of operational costs lost to fragmentation.
How connected hotel technology turns RevPAR insight into action
Manual processes and disconnected reporting slow down the decisions that move RevPAR. Technology won't write your pricing strategy for you but it removes what's stopping you building one.
What your hotel PMS needs to do to support RevPAR decisions
Most revenue decisions depend on occupancy and rate data being current and easy to act on. When that data is spread across systems, or it needs a manual export first, the decision gets made late or it doesn't get made at all.
A hotel PMS that surfaces RevPAR, ADR and occupancy in one place is the baseline. It then needs to work with the rest of your stack, so your hotel RMS, booking engine, hotel CRS and channel manager are all reading from the same picture as it updates. That's what gives your team the information when they need it rather than a week after.
Forecasting and budgeting with RevPAR in mind
Set RevPAR budgets by segment and by period, then track against them weekly. Gaps show up early enough to do something about them.
Read your pace report next to the budget by looking at what's on the books, how that compares with the same time last year, and whether the gap is closing or widening. RevPAR targets should feed your forecast.
RevPAR is just the starting point
Understanding what drives RevPAR and having a connected system in place to act at the right time is what separates hotels that are improving their RevPAR from those that are simply tracking it.
For a fuller picture of your hotel performance, we recommend reading RevPAR alongside TRevPAR (Total Revenue Per Available Room), GOPPAR (Gross Operating Profit Per Available Room) and labor cost as a percentage of revenue. RevPAR is an important starting point, but it's one number among several that matter.
At Access Hospitality, we work with independents, management companies and multi-property groups to bring revenue and operational data into one place. When your rate data, booking pace and operational picture all read from the same source, your pricing becomes specific to your hotel instead of the market in general.