
 UK
UK
 AU & NZ
 SG
SG
 US
US
 IE
IE
Financial Reporting Software by The Access Group
To thrive in a fast-changing world, you need data and insights to effectively run your business. Access Analytics enables Access UBS customers to easily view and understand their accounting, inventory, and payroll performance. Achieve smarter decision-making for your business with our suite of pre-built reports or create your own customised dashboards leveraging our visualisation tools.

Centralised Finance and Accounting Reporting Software
Access Analytics for UBS
Access Analytics extracts data from your UBS system saving you time from data preparation and export. With data from your accounting, inventory and payroll displayed in dashboards, you can easily view and understand your business performance. Running on the cloud, your users can view the dashboards anytime, anywhere. Access controls can also be set to ensure the dashboards are available only to staff with permission to view.
Take your management performance to the next level
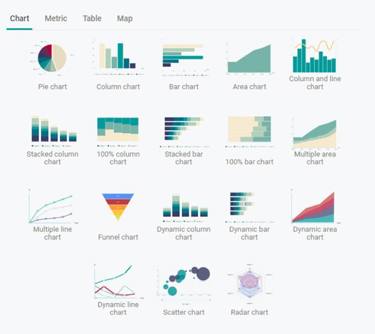
Harness the power of visualisation to communicate the pulse of your business companywide. Access Analytics for UBS offers an extensive suite of pre-built dashboards, enabling you to easily see the strengths and gaps across every aspect of your business. You can also leverage our visualisation tools to create additional customised dashboards from your data set.
Harness the power of expanded insights
Access Analytics for UBS empowers customers to hit the ground running with standard pre-built dashboard insights which they are familiar with. Additional dashboard insights are also included, enabling you to gain a broader and deeper understanding of your accounting, inventory, and payroll operations.
Access UBS Accounting
Standard dashboards:
- 12 Months – Chart (Cost, Revenue, Expenses, Net Profit, Profit and Loss)
- Top 10 Overdue (Customer, Supplier)
- AR Aging Chart (6 Months, 12 Months)
- Monthly Collection by Agent (Period 1-6, Period 7-12)
- Debtors with Outstanding exceeding 3 months
- Customer Outstanding Analysis
- Monthly Sales vs Collection
Additional dashboards:
- Total Customers – Active
- Total A/R Outstanding Balance
- Customer Listing
- Accounts Receivable Collections
- Accounts Receivable Over Credit
- Accounts Receivable Overdue Aging-Due Date
- Accounts Receivable Overdue Aging-Transaction Date
- Accounts Receivable Collections-Transaction Date
- Total Suppliers-Active
- Accounts Payable Outstanding Balance
- Supplier Listing
- Accounts Payable Over Credit Limit
- Accounts Payable Overdue Aging-Transaction Date
- Accounts Payable Overdue Aging-Due Date

Access UBS Inventory & Billing

Standard dashboards:
- Top 10 by Current Month (Sales Categories, Sales Agents, Sales Customers, Sales Returned Items, Product Sales Value, Product Sales Quantity, Item Purchases, Purchases Categories, Purchases Vendor)
- Top 10 by Last Month (Product Sales Value, Product Sales Quantity)
- Top 10 Outstanding Sales Order by Agent
- Outstanding Sales Order by Period
Additional dashboards:
- Total number of Items
- Total Value of Inventory
- Inventory Value by Group
- Items On Hand Below Min Qty
- Items On Hand Above Max Qty
- Items On Hand Below Reorder Qty
- Item Sales by Month.
- Item Batch Expiry
Access UBS Payroll

Payroll Statistics
- Total Employee Count, Total Monthly Basic Wage
- Employee by Pay Type
- Wage Comparison This Month versus Last Month
- Annual Basic Wage by Department
- Basic Wage by Department and Age Group
Workforce Management
- Total Active Employees
- Average Age of Employees
- Gender Diversity, Headcount by Gender
- Total Resignations YTD, Total New Hires YTD
- Headcount (Age Group, Experience, Education, Nationality)
- Hiring Trend
HRMS information
- Employees Birthday This Month
- Work Permit Due, Contract Due
- Employee Listing
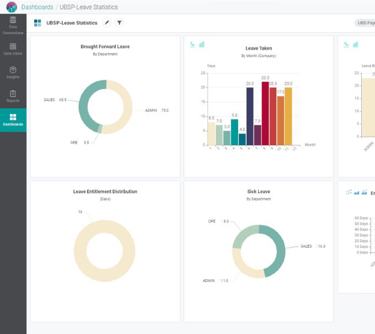
Leave Statistics
- Brought Forward Leave by Department
- Leave Consumption by Month
- Leave Balance by Department
- Annual Leave Taken by Department and Month
- Leave Entitlement Distribution
- Sick Leave
- Leave Taken by Department
- Breakdown of Leave Taken (Type and Department)
Find out more about Access Analytics for UBS. Contact us to request a demonstration or a discussion.
Access Analytics FAQs
What does the Access Analytics do? / About Access Analytics
Access Analytics is a financial reporting software provided by The Access Group. It enables businesses to gain insights and visibility into their accounting, inventory, and payroll performance. The software offers pre-built reports and customizable dashboards, allowing users to easily view, understand, and analyze their financial data.
Why is a Finance Reporting software necessary?
A Finance Reporting software is necessary for businesses to effectively manage and analyze their financial data. It provides accurate and real-time information about the company's financial performance, allowing for informed decision-making. By automating the reporting process and offering comprehensive data visualization tools, it simplifies financial analysis and helps identify trends, risks, and opportunities.
How does the Access Analytics tool improve your accounting reporting system?
The Access Analytics tool enhances your accounting reporting system in several ways. It centralizes your finance and accounting data, making it easier to access and analyze. With pre-built dashboards and visualization tools, it enables you to quickly and intuitively understand your financial performance. The software also saves time by automating data preparation and export from your accounting, inventory, and payroll systems. Additionally, it provides expanded insights and allows you to create custom dashboards tailored to your specific reporting needs.